The profit and loss statement, also known as the income statement, is a key financial document that provides insights into a company’s financial performance. This blog will explore the structure, components, and real-world applications of the profit and loss statement, helping you understand how to effectively analyze a business’s financial health.
Introduction to Financial Statements
Financial statements serve as the backbone of financial reporting for any business. They provide essential insights into a company’s financial health, performance, and cash flows. Understanding these documents is crucial for stakeholders, including investors, creditors, and management, to make informed decisions.
At their core, financial statements are standardized reports that summarize the financial activities of a business over a specific period. They help communicate the results of operations, financial position, and cash flows, enabling users to assess the company’s overall viability and profitability.
Overview of the Three Main Financial Statements
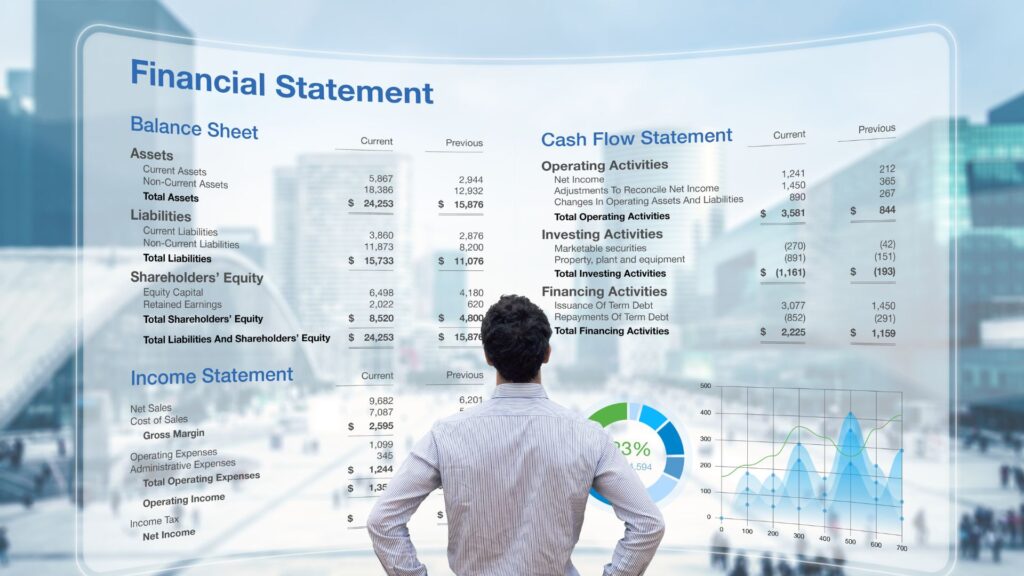
Businesses prepare three primary financial statements: the Balance Sheet, the Income Statement aka Profit and Loss Statement, and the Cash Flow statement. Each statement serves a unique purpose and provides different insights.
- Balance Sheet: Offers a snapshot of a company’s assets, liabilities, and shareholders’ equity at a specific point in time.
- Income Statement: Also known as the profit and loss statement, this document outlines the company’s revenues and expenses over a period, ultimately revealing net income.
- Cash Flow Statement: Details cash inflows and outflows from operating, investing, and financing activities, showcasing how well a company manages its cash.
Understanding the Balance Sheet
The balance sheet is structured to present a company’s financial position at a specific moment in time. It is divided into three main sections:
- Assets: Resources owned by the company, including current and non-current assets.
- Liabilities: Obligations owed to outside parties, categorized as current and long-term liabilities.
- Shareholders’ Equity: The residual interest in the assets of the company after deducting liabilities, representing the owners’ claim on the business.
The fundamental equation underlying the balance sheet is:
Assets = Liabilities + Shareholders’ Equity
This equation illustrates that all assets must be financed either through debt or equity. Understanding the balance sheet is vital for assessing a company’s liquidity and financial stability.
The Cash Flow Statement Explained
The cash flow statement provides insight into how a company generates and utilizes cash. It is divided into three main sections:
- Operating Activities: Cash flows from core business operations, including receipts from customers and payments to suppliers and employees.
- Investing Activities: Cash flows related to the acquisition and disposal of long-term assets, such as property and equipment.
- Financing Activities: Cash flows associated with borrowing and repaying debt, as well as transactions with shareholders.
This statement is crucial for understanding a company’s liquidity position and its ability to meet short-term obligations. A positive cash flow indicates that a company can sustain its operations and invest in growth opportunities.
Introduction to the Profit and Loss Statement
The profit and loss statement, also known as the income statement, is a key financial document that summarizes a company’s revenues and expenses during a specific period. It provides a clear picture of the company’s ability to generate profit by increasing revenue, reducing costs, or both.
This statement is essential for stakeholders looking to assess the operational performance of a business. It helps in understanding how well a company is managing its resources and generating earnings.
GAAP Structures of the Income Statement
Under Generally Accepted Accounting Principles (GAAP), the income statement can be formatted in two primary ways:
- Single-Step Format: This format aggregates all revenues and gains and subtracts all expenses and losses. It provides a straightforward view of net income without detailing the components.
- Multi-Step Format: This more detailed format separates operating and non-operating activities. It includes subtotals like gross profit and operating income, offering deeper insights into profitability.

The multi-step income statement is particularly useful for stakeholders as it highlights the performance of core business activities. It allows for better analysis of trends and operational efficiencies over time.
Single-Step Income Statement Format
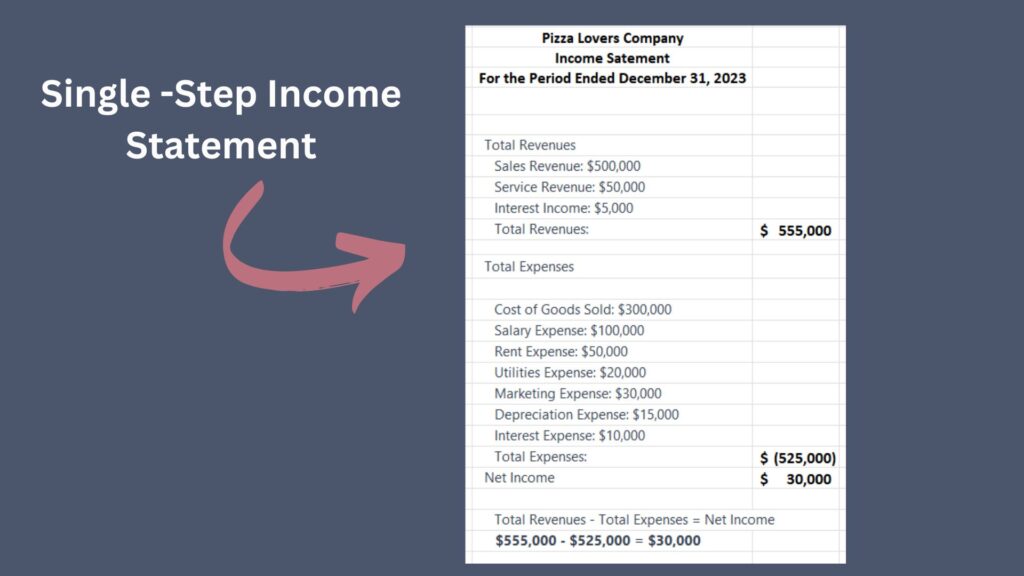
The single-step income statement format is straightforward and easy to understand. In this format, all revenues and gains are presented together at the top, followed by all expenses and losses. The net income is calculated by simply subtracting total expenses from total revenues.
This format emphasizes the bottom line, making it suitable for smaller businesses or those with uncomplicated financial structures. However, it lacks detailed insights into operational efficiency, which can limit its usefulness for in-depth financial analysis.
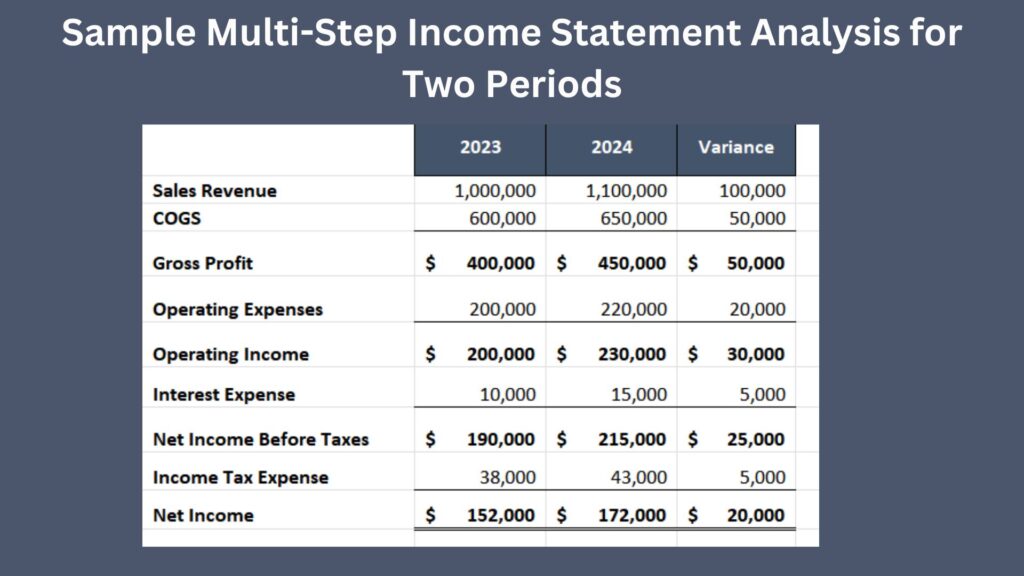
Multi-Step Income Statement Format
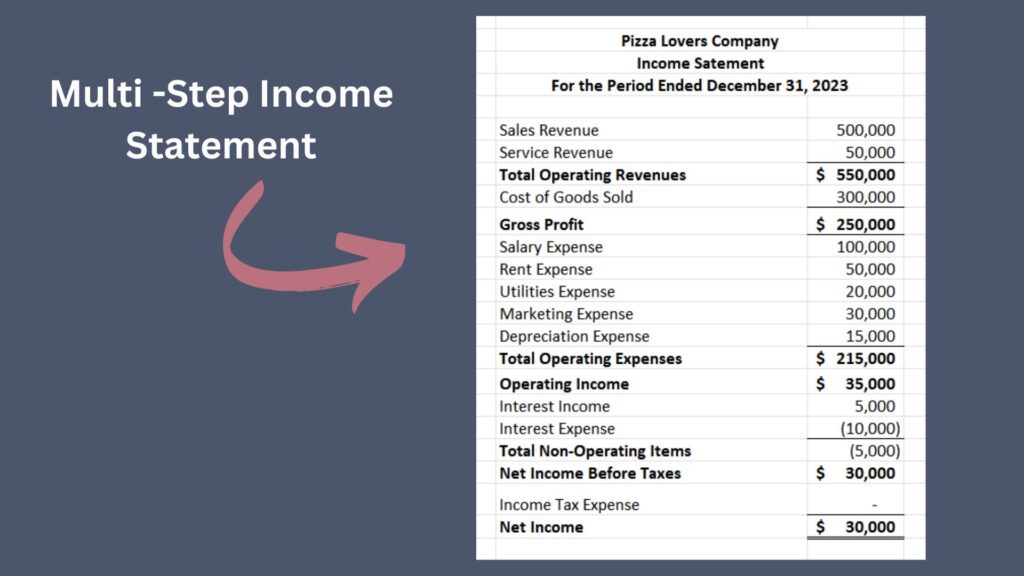
The multi-step income statement format provides a more comprehensive view of a company’s financial performance. It separates operating revenues and expenses from non-operating ones, allowing for a clearer analysis of profitability.
This format includes key subtotals such as gross profit and operating income, which help stakeholders evaluate the company’s efficiency in generating income from core operations. The multi-step format is especially beneficial for larger businesses or those with more complex financial activities.
Detailed Breakdown of Multi-Step Income Statement
A multi-step income statement typically consists of several key components:
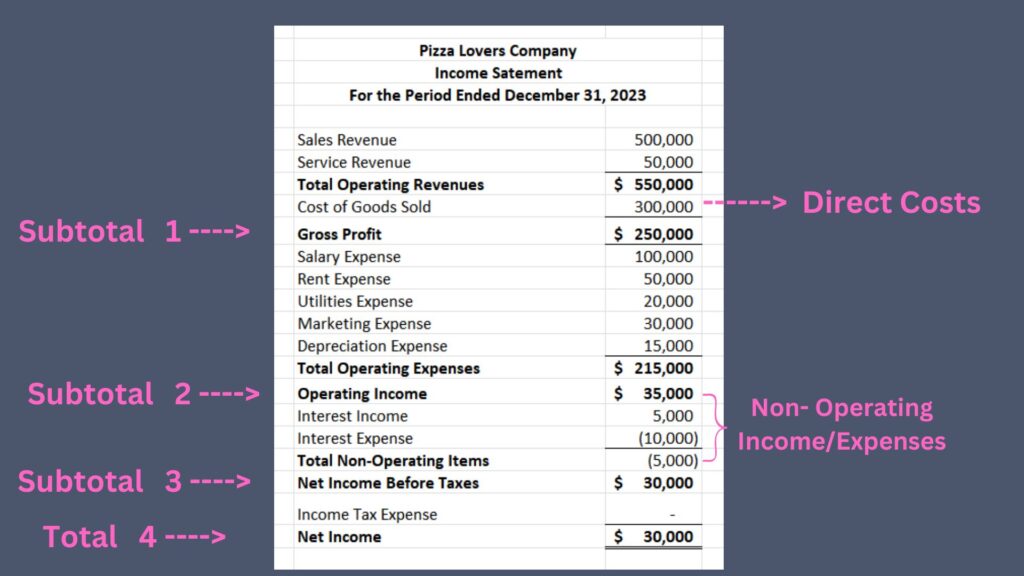
- Gross Revenue: Total income generated from sales before any deductions.
- Cost of Goods Sold (COGS): Direct costs associated with the production of goods sold.
- Gross Profit: The difference between gross revenue and COGS, indicating how efficiently a company produces its goods.
- Operating Expenses: Costs required to run the business that are not directly tied to production, including selling, general, and administrative expenses.
- Operating Income: Gross profit minus operating expenses, reflecting the profitability of core business activities.
- Non-Operating Income: Revenues and expenses not related to core business operations, such as interest income or expenses.
- Income Before Taxes: The sum of operating income and non-operating income, showing profitability before tax obligations.
- Net Income: The final profit after accounting for all revenues, expenses, and taxes.
Detailed Line Items in Multi-Step Format
The multi-step income statement is rich in detail, providing line items that reflect the intricacies of a business’s financial activities. Each section contributes to a clearer understanding of operational success and areas needing improvement.
Understanding Gross Revenue
At the top of the income statement, you’ll find Gross Revenue, which represents the total income generated from all business operations. This includes revenue from the sale of products or services. The term “gross” indicates that this figure is the total amount before any expenses have been subtracted.
Understanding Direct Costs – Cost of Goods Sold (COGS)
Direct costs, often referred to as the cost of sales or cost of goods sold (COGS), are expenses directly tied to the production of goods or services. These costs can be traced back to specific products or services sold and typically vary with sales volume.
- Examples:
- Raw materials for manufacturing
- Direct labor costs
- Purchase price of products for resale
Understanding these costs is crucial as they directly impact gross profit. A high COGS can diminish profitability, indicating inefficiencies in production or pricing strategies.
Calculating Gross Profit
Gross profit is calculated by subtracting the cost of goods sold from total revenue. This figure serves as a critical indicator of a company’s efficiency in managing its production costs relative to its sales.
To calculate gross profit:
- Determine total revenue from sales.
- Subtract the cost of goods sold (COGS).
- The result is your gross profit.
This metric is essential for assessing how well a company is producing and selling its products, providing insight into operational effectiveness.
Indirect Costs – Operating Expenses Explained
Indirect costs, often referred to as overheads, are operating expenses that cannot be directly traced to the production of goods or services. These costs are essential for running the business but do not fluctuate directly with sales.
- Types of Indirect Costs:
- Fixed Costs: Rent, salaries, and insurance.
- Variable Overheads: Advertising and utility costs that may change with production levels.
Understanding indirect costs is vital for calculating operating profit. While these costs may not directly impact the production process, they significantly affect overall profitability and must be managed effectively.
Determining Operating Income
Operating profit, also known as operating income, is a critical measure of a company’s profitability derived from its core business operations. To calculate operating profit, you take gross profit and subtract operating expenses, which include both direct and indirect costs associated with running the business.
The formula can be expressed as:
Operating Profit = Gross Profit – Operating Expenses
This metric provides insight into how well a company is managing its day-to-day operations, excluding any income generated from investments or other non-operational activities.
Components of Operating Income
Operating profit encompasses several key components:
- Gross Profit: The profit from sales after deducting the cost of goods sold.
- Operating Expenses: These include fixed and variable costs, such as salaries, rent, utilities, and marketing expenses.
By analyzing operating profit, stakeholders can assess the efficiency of a company’s operations and its ability to generate profit from its primary business activities.
Interest Expenses & Tax Considerations
When calculating net profit, it is essential to consider interest expenses, a non-operating expense, and taxes. These costs are often excluded from operating profit as they do not relate to core operational activities.
Interest expenses arise from borrowing, while taxes are obligatory payments based on profit levels. Both can significantly impact the bottom line.
Calculating Net Profit
Net profit is the ultimate measure of profitability, calculated as follows:
Net Profit = Operating Profit – Interest Expenses – Taxes
This figure reflects the total income remaining after all expenses have been deducted. Understanding net profit is crucial for stakeholders as it indicates the true profitability of a business.
Differentiating Between Gross Profit, Operating Profit, and Net Profit
Understanding the distinctions between gross profit, operating profit, and net profit is vital for analyzing a company’s financial health:
- Gross Profit: Indicates the efficiency of production and sales processes.
- Operating Profit: Reflects the profitability from core operations, excluding non-operational income and expenses.
- Net Profit: The final profit figure after all expenses, including interest and taxes, have been deducted.
Each type of profit provides valuable insights into different aspects of a business’s financial performance, helping stakeholders make informed decisions.
Using Multi-Step Income Statement for Financial Analysis
The multi-step income statement is a valuable tool for financial analysis. By providing detailed information about revenues and expenses, it allows stakeholders to assess a company’s operational efficiency and profitability.
Analysts can compare income statements across periods to identify trends and measure performance. For example, an increase in gross profit margin may indicate improved production efficiency or effective pricing strategies.
Additionally, separating operating and non-operating income helps investors evaluate how well a company manages its core operations compared to other financial activities.
The Importance of Comparative Periods
Comparative periods are crucial for evaluating a company’s performance over time. By comparing financial results from different timeframes, businesses can identify trends, assess growth, and make informed strategic decisions.
Common comparative periods include:
- Month-over-Month: Comparing results from one month to the previous month.
- Year-over-Year: Analyzing financial performance from one year to the next.
- Quarter-over-Quarter: Assessing changes in performance from one quarter to another.
These comparisons allow businesses to track progress, understand seasonal trends, and identify areas for improvement.
Analyzing Changes
When looking at comparative periods, it’s essential to analyze the changes in key metrics. For instance, if sales have increased but gross profit remains the same, it may indicate rising costs or discounts affecting profitability. Understanding these nuances is vital for effective decision-making.
Example Analysis: An Imaginary Company
Let’s consider an imaginary company, ABC Corp, to illustrate the importance of comparative analysis. In Year 1, ABC Corp reported:
- Total Revenue: $100,000
- Cost of Goods Sold (COGS): $40,000
- Operating Expenses: $30,000
In Year 2, the figures changed to:
- Total Revenue: $120,000
- Cost of Goods Sold (COGS): $50,000
- Operating Expenses: $35,000
Calculating the operating profit for both years:
- Year 1:
- Gross Profit = $100,000 – $40,000 = $60,000
- Operating Profit = $60,000 – $30,000 = $30,000
- Year 2:
- Gross Profit = $120,000 – $50,000 = $70,000
- Operating Profit = $70,000 – $35,000 = $35,000
The increase in operating profit from $30,000 to $35,000 highlights the company’s improved efficiency, despite rising costs in both COGS and operating expenses.
Financial Ratio Analysis – Gross Profit Margin
Gross profit margin is a key financial metric that measures the efficiency of a company’s production process. It is calculated by dividing gross profit by total revenue:
Gross Profit Margin = (Gross Profit / Total Revenue) x 100
This ratio indicates how much of each dollar of revenue is retained as gross profit. A higher gross profit margin signifies better efficiency and pricing strategies.
Interpreting Gross Profit Margin
For instance, if ABC Corp’s gross profit margin in Year 1 was:
Gross Profit Margin = ($60,000 / $100,000) x 100 = 60%
And in Year 2:
Gross Profit Margin = ($70,000 / $120,000) x 100 = 58.33%
The decline in gross profit margin suggests that while revenue increased, the cost of goods sold rose at a faster rate. This calls for a deeper analysis of pricing, production efficiency, and cost management strategies.
Conclusion
Understanding the profit and loss statement is crucial for analyzing a company’s financial performance. It serves as a key indicator of profitability, efficiency, and overall operational health.
In summary, the profit and loss statement is not just a historical record; it is a powerful tool that can guide future business strategies and enhance financial decision-making. Embrace its insights to drive your business forward.
FAQ About The Profit and Loss Statement
What is a profit and loss statement?
A profit and loss statement, also known as an income statement, is a financial statement that summarizes a company’s revenues and expenses over a specific period, typically a fiscal year or quarter. The main purpose of this statement is to provide insights into a company’s financial performance, showing whether the company has made a profit or loss during that period. The profit and loss statement is crucial for stakeholders to understand the company’s ability to generate earnings and manage its costs effectively.
How do you read a profit and loss statement?
Reading a profit and loss statement involves analyzing its various components, which typically include revenues, cost of goods sold (COG), gross profit, operating expenses, and net income. Start by looking at the top line, which shows the total revenues generated by the company. Next, subtract the cost of goods sold to find the gross profit. Then, deduct operating expenses, interest expense, and taxes to arrive at the net income. Understanding these elements helps in evaluating a company’s financial health and profitability.
What is the difference between revenue and net income?
Revenue refers to the total amount of money generated from sales before any expenses are deducted. In contrast, net income is the profit remaining after all costs, including operating expenses, interest expenses, and taxes, have been subtracted from total revenues. Thus, while revenue indicates the company’s total sales, net income provides a clearer picture of profitability.
What are operating expenses?
Operating expenses are the costs associated with running a business that are not directly tied to the production of goods or services. These expenses include rent, utilities, salaries, and marketing costs. Understanding operating expenses is essential for analyzing a company’s overall financial health and its ability to generate profit after covering these costs.
What does the term gross profit mean?
Gross profit is the difference between total revenue and the cost of goods sold. It represents the amount of money a company makes from its core business operations before accounting for overhead costs and other expenses. A high gross profit indicates that the company is effective at managing its production costs relative to its sales.